断点调试
Visual Studio Code
创建配置
VSCode IDE要运行或者调试golang程序之前,需要创建运行配置 launch.json ,方法如下: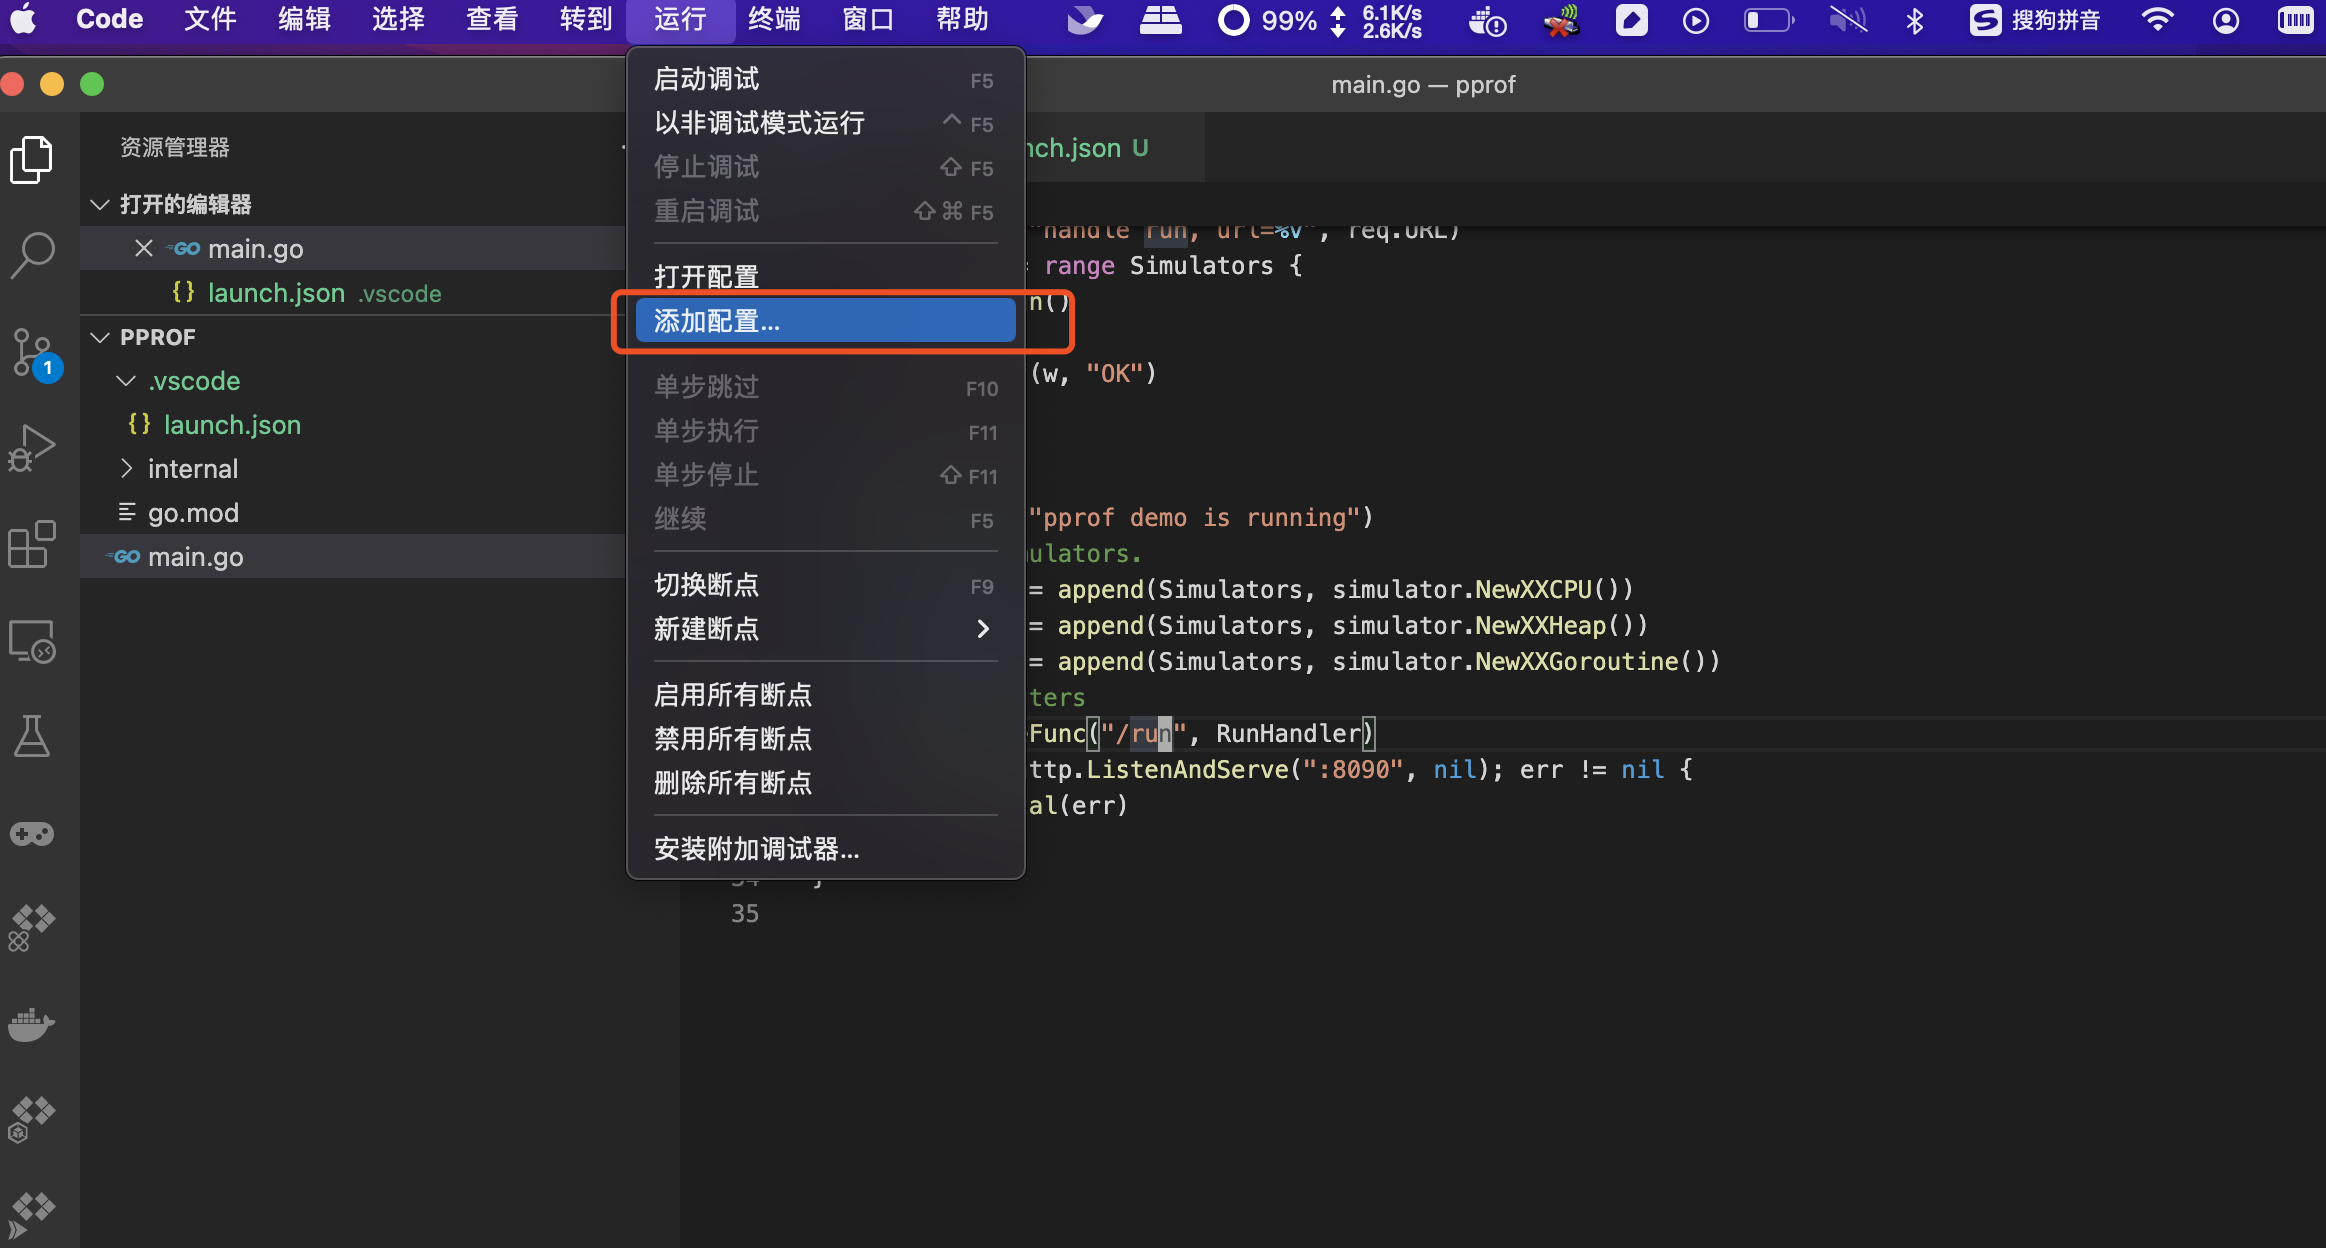
打开菜单“运行”->“添加配置”,在创建的配置添加如下内容:
1 | { |
配置说明:
cwd:当前工作目录,可以使用变量 ${workspaceFolder} 。
program:可执行程序或者文件。
args:程序运行所需参数,数组类型。
更多配置的用法请参考 visualstudio debugging
调试方法
设置断点,如下图所示: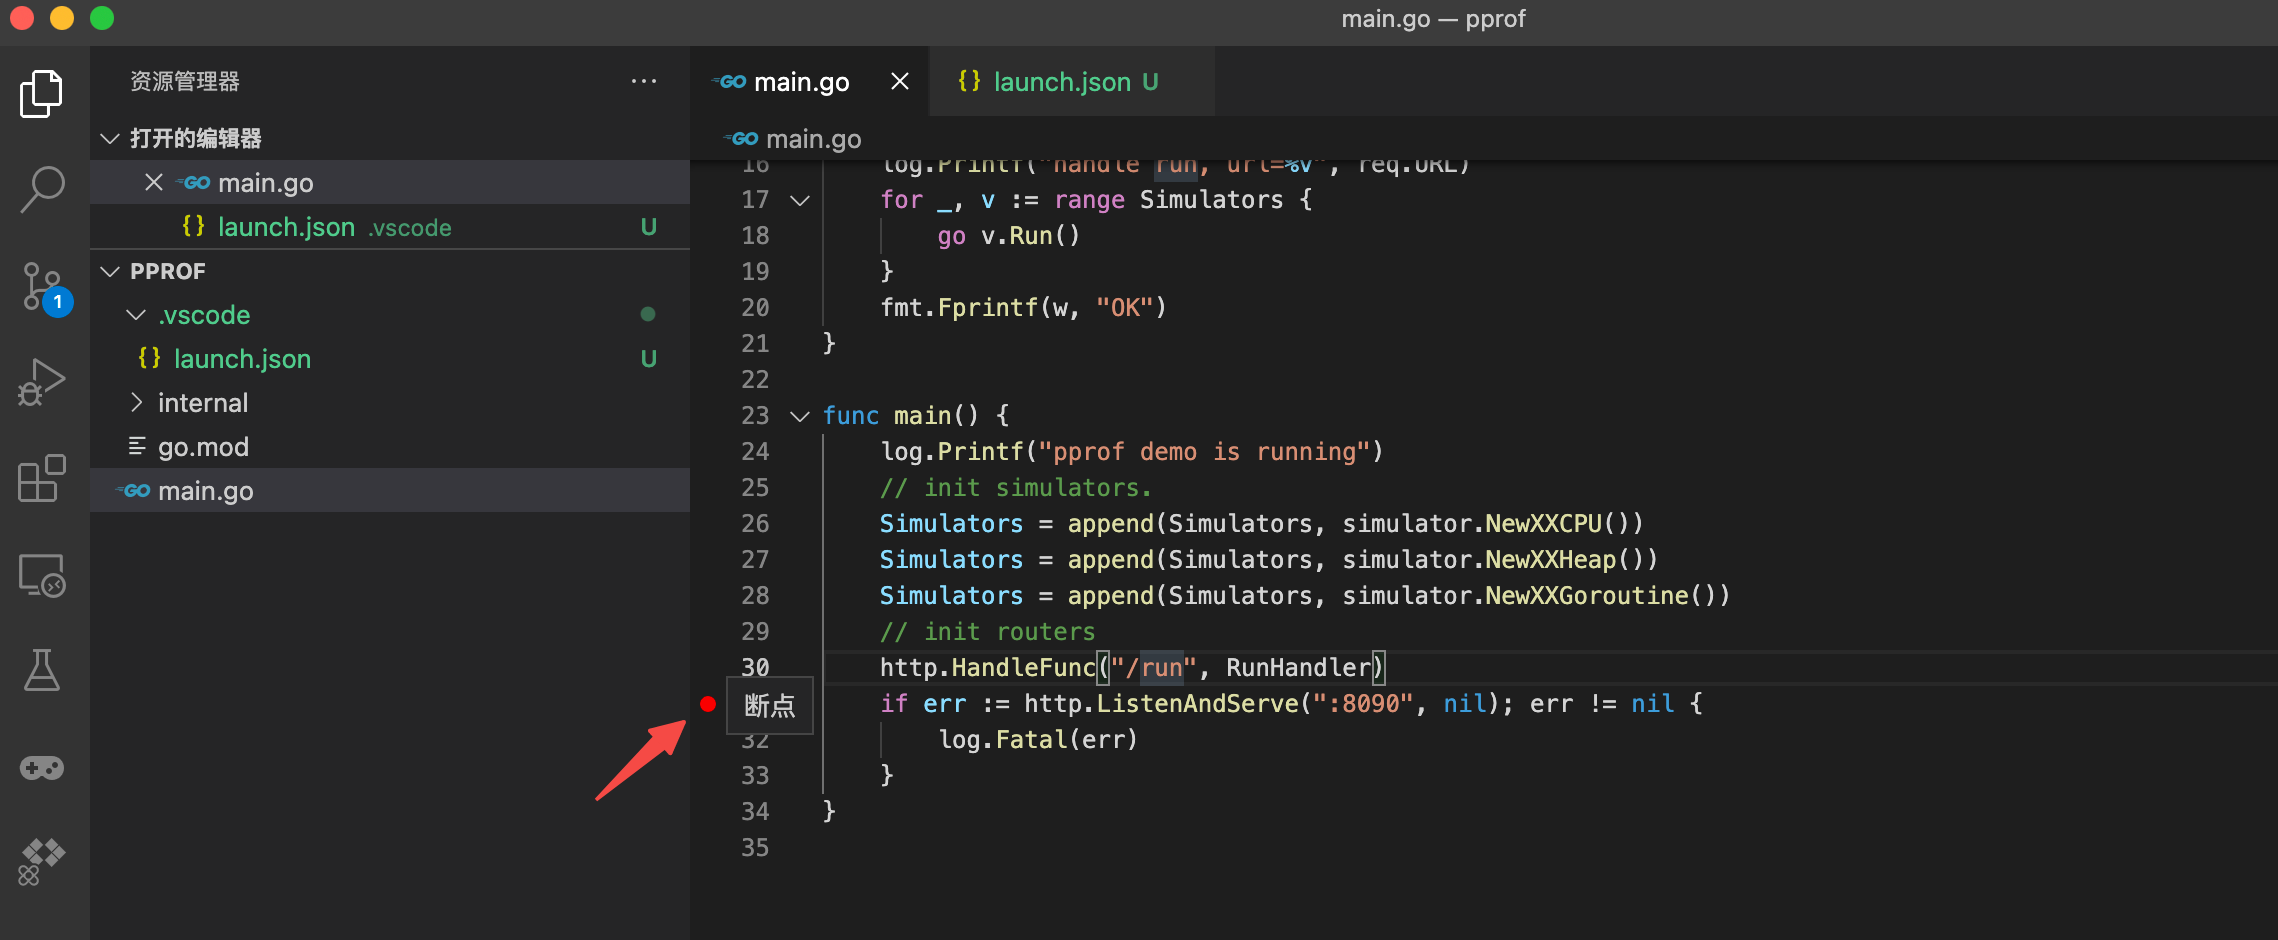
使用快捷键F5,或者打开菜单,点击“运行”->“启动调试”,调试主界面如下,这样就可以愉快的调试了。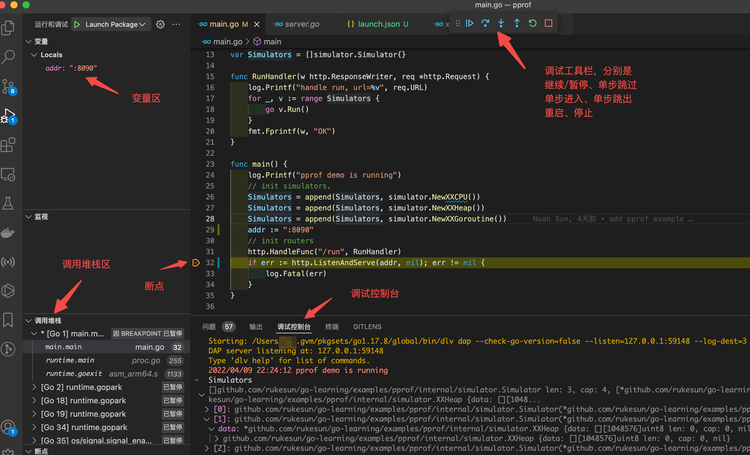
GoLand
创建配置
打开菜单,“Run”->“Debug”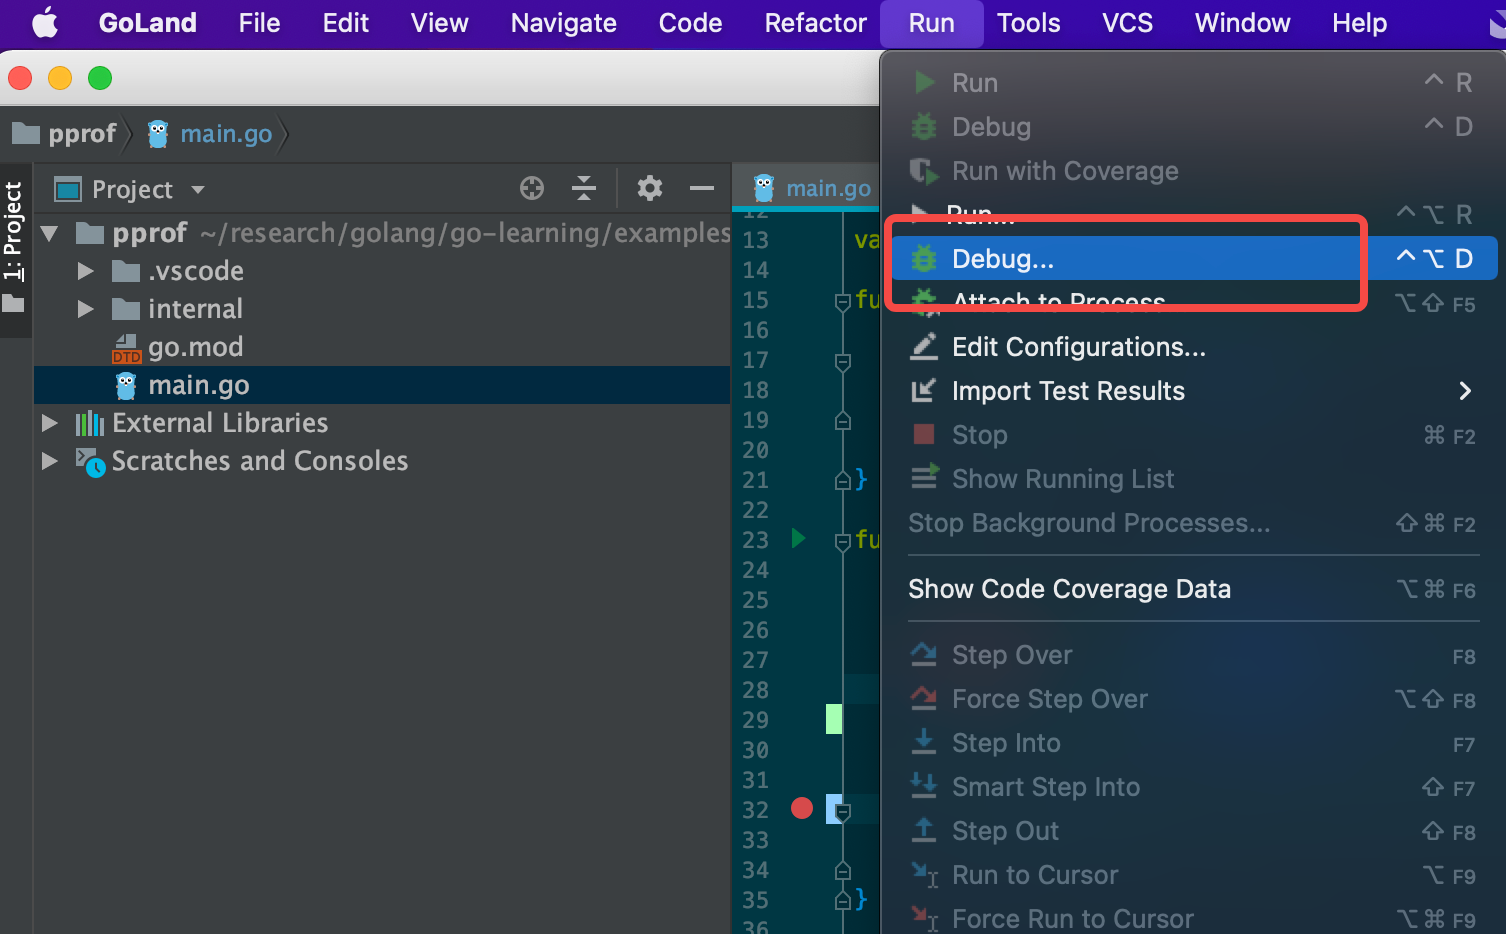
在弹出框选“Edit Configurations”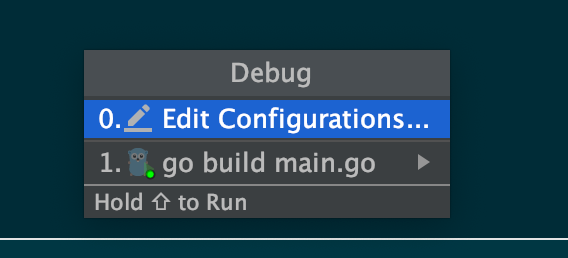
编辑配置如下图所示,编辑完后点击Apply应用即可完成。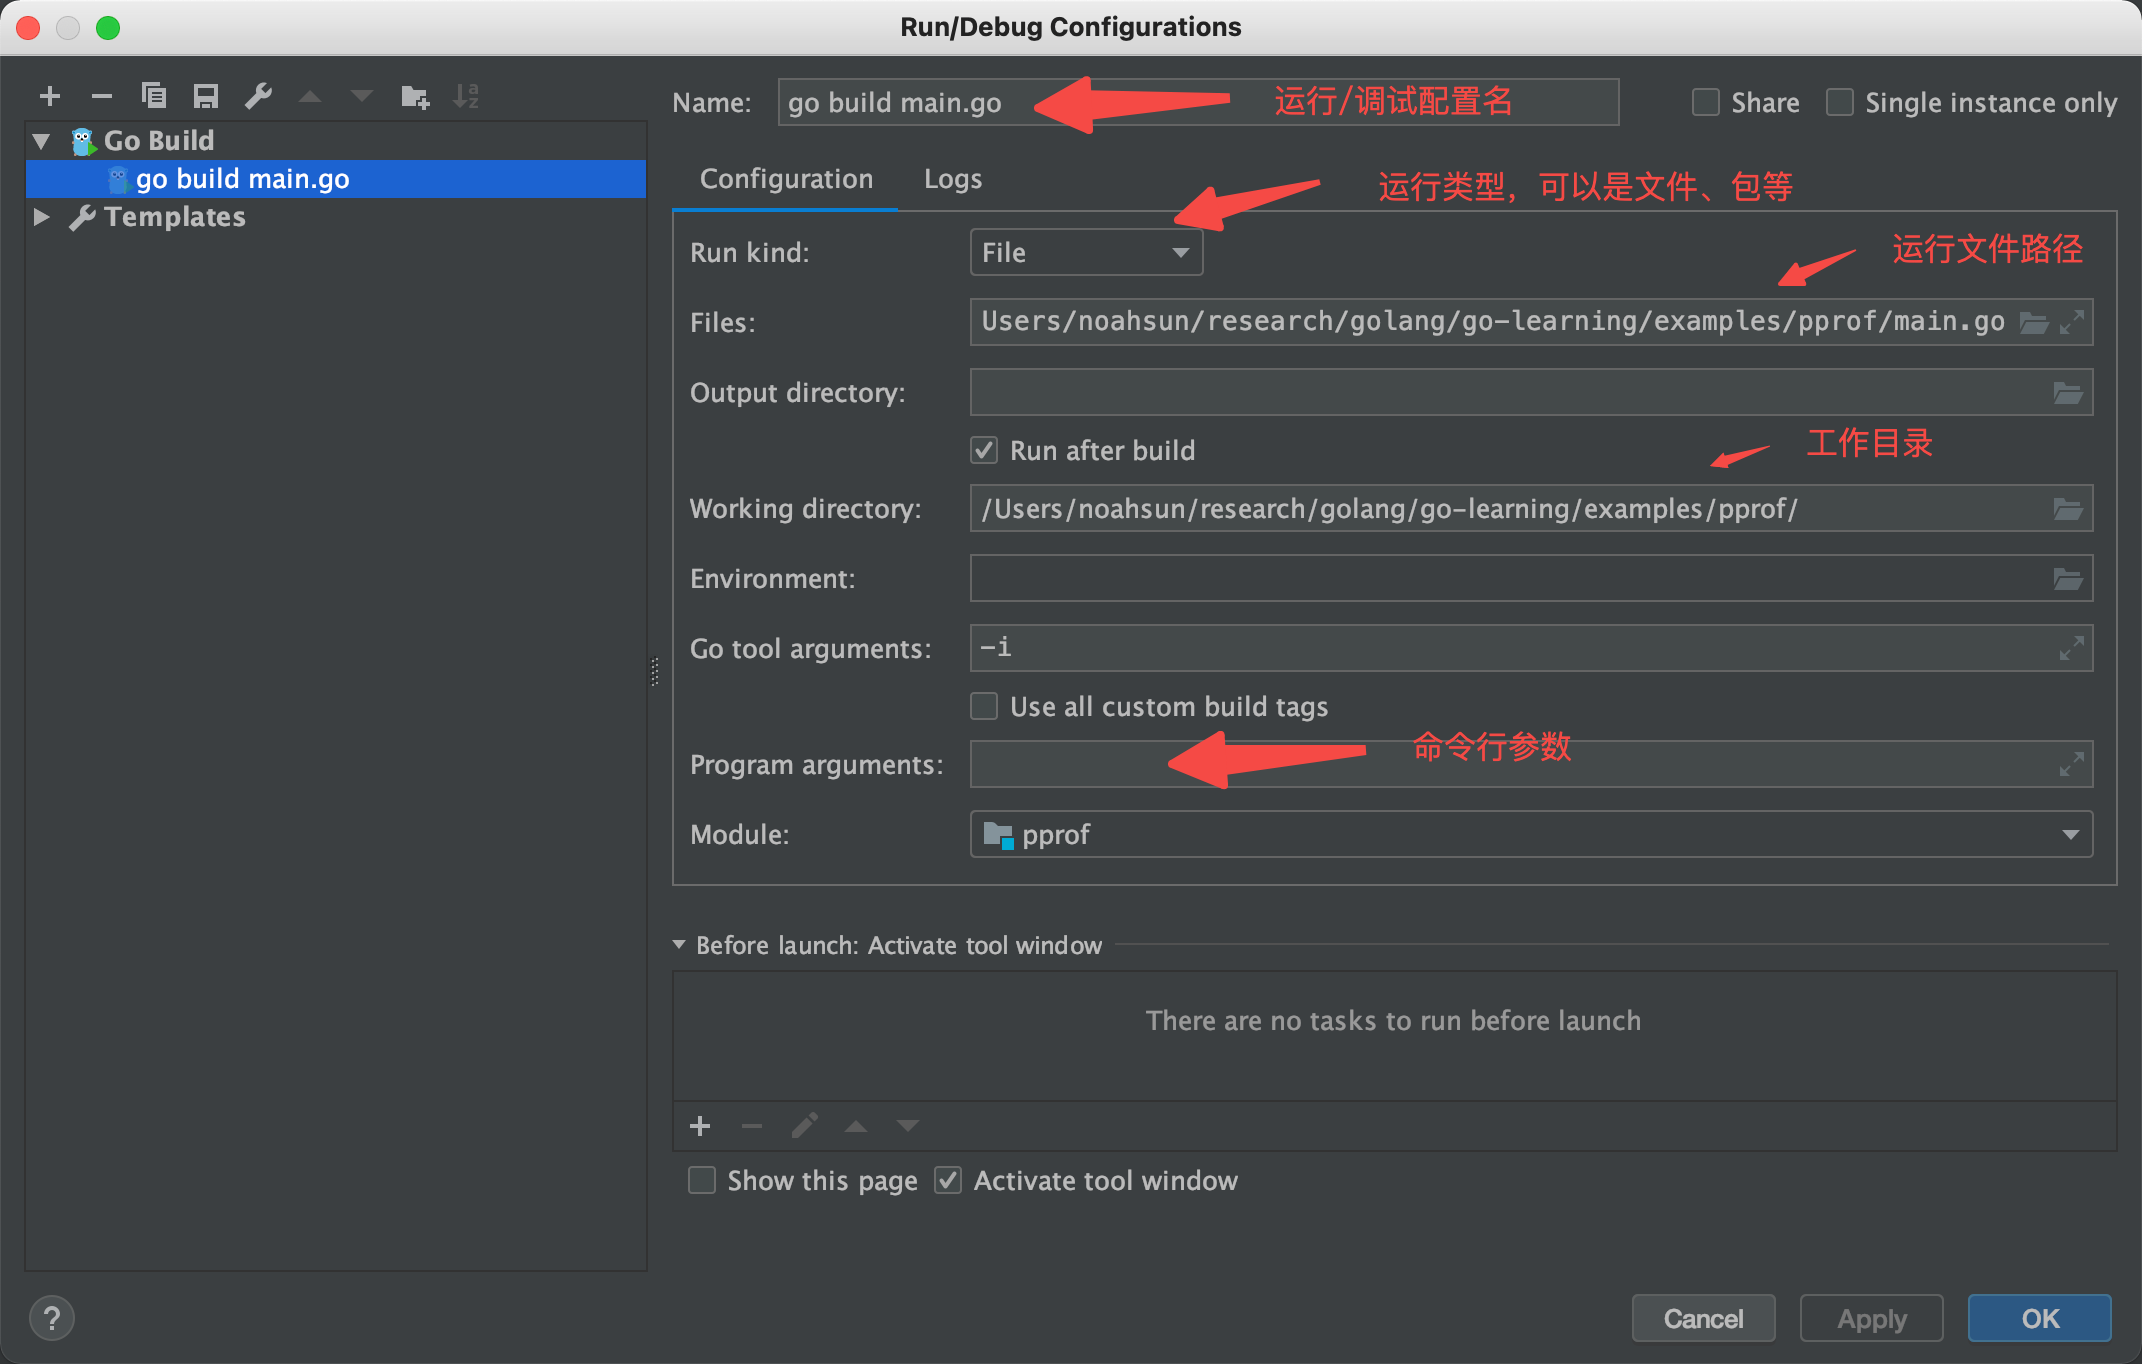
调试方法
设置断点,如下图所示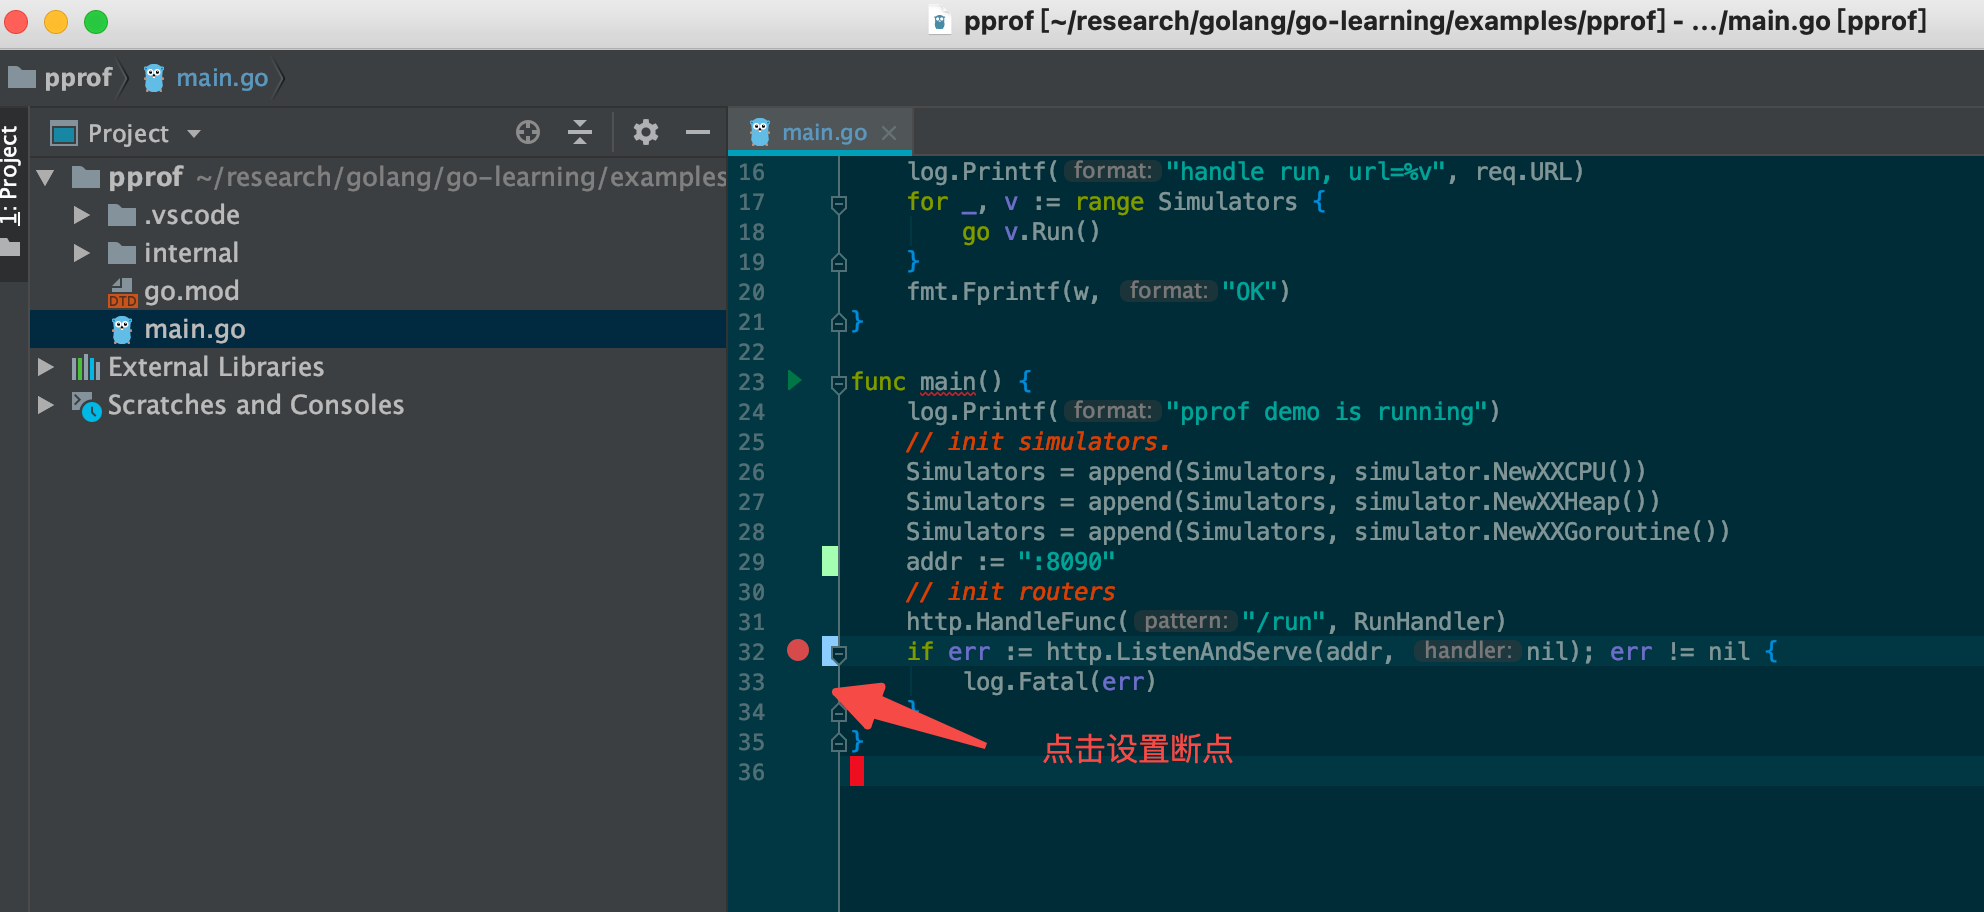
启动debug,MAC快捷键control+option+D,或者点击菜单“Run”->“Debug”,选择之前创建的配置,即可调试,如下图所示: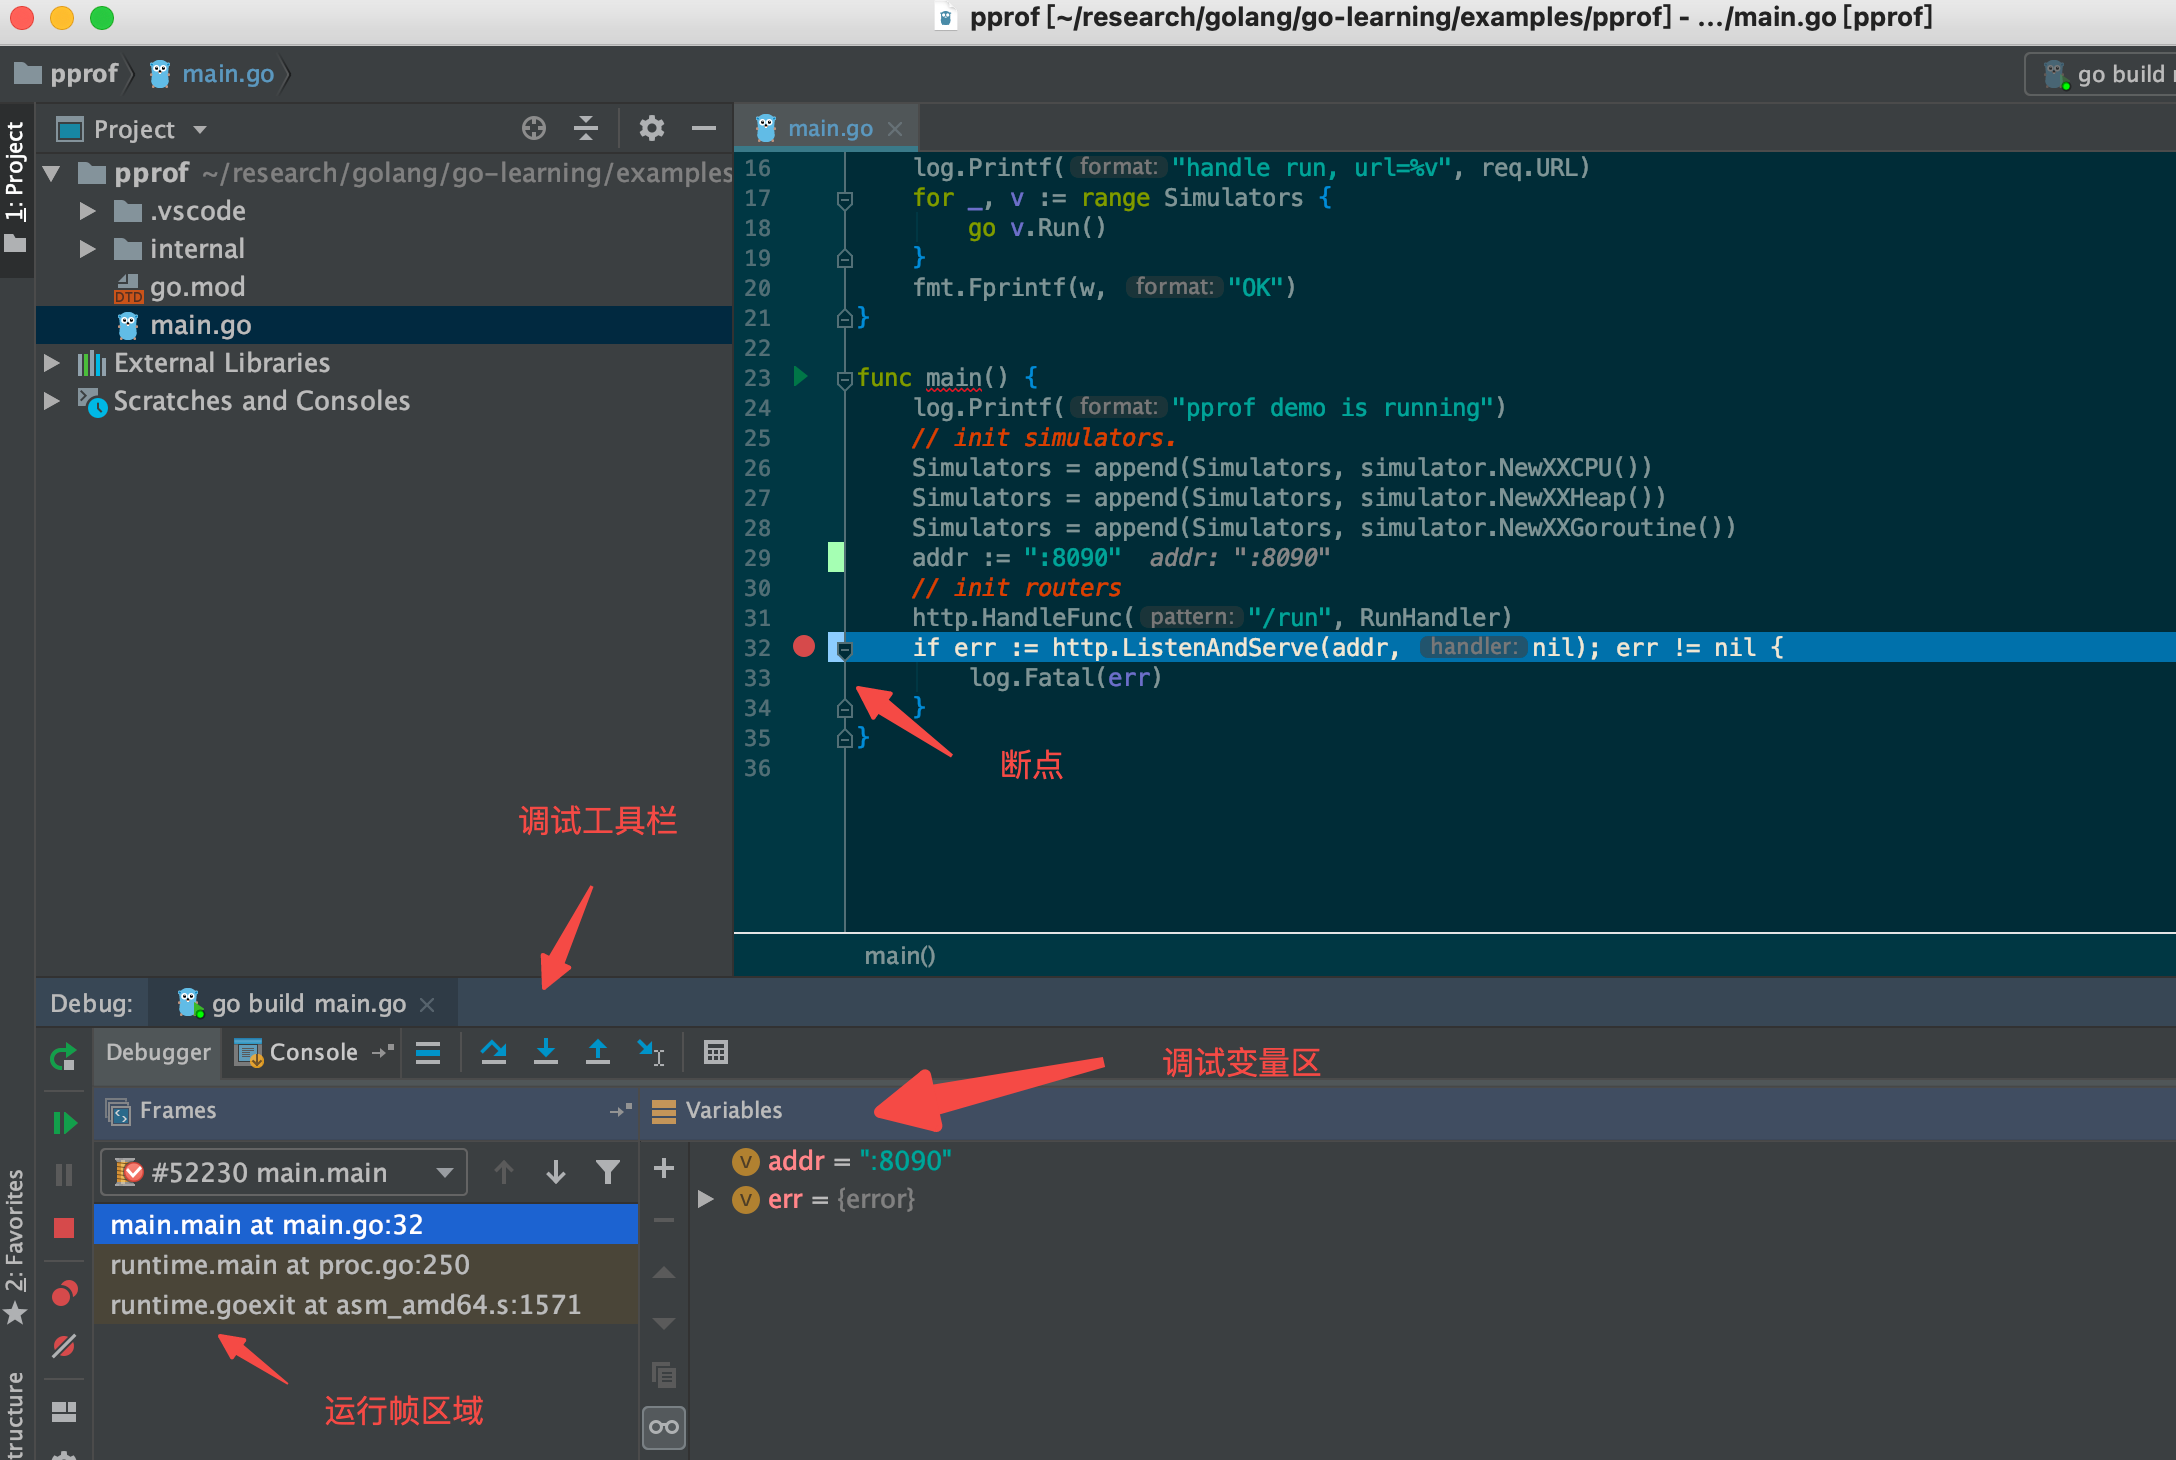
性能分析
pprof
pprof是Go的性能分析工具,在程序运行过程中,可以记录程序的运行信息,包括CPU、内存、goroutine、锁等。golang标准库提供了以下两种使用方式:
- net/http/pprof:采集 HTTP Server 的运行时数据进行分析
- runtime/pprof:采集程序(含Server和非Server)的运行数据进行分析
另外,golang也提供了比较多好用的可视化工具来负责开发者做分析,使用方式包括报告的生成、交互式终端和Web界面。
pprof工具准备
1 | # 安装pprof工具 |
分析使用
本例使用的完整 demo 放在 go-learing 的 examples/pprof 目录下。
标准库自带Web界面
使用方法
简单的demo
1 | package main |
本例子使用标准库提供的 “net/http/pprof” 包,通过import该包后,HTTP服务程序就会注入 /debug/pprof 相关的路由,可以访问 http://localhost:8090/debug/pprof/ 查看总览,如下所示
1 | /debug/pprof/ |
下面是各种 profile 的描述:
- allocs: A sampling of all past memory allocations. 过去所有内存分配的抽样。
- block: Stack traces that led to blocking on synchronization primitives. 导致同步原语阻塞的堆栈跟踪。
- cmdline: The command line invocation of the current program. 当前程序的命令行调用。
- goroutine: Stack traces of all current goroutines. 堆栈当前所有goroutines的跟踪。
- heap: A sampling of memory allocations of live objects. You can specify the gc GET parameter to run GC before taking the heap sample. 活动对象的内存分配抽样。在获取堆样本之前,可以指定gc GET参数来运行gc。
- mutex: Stack traces of holders of contended mutexes. 竞争互斥锁持有者的堆栈跟踪。
- profile: CPU profile. You can specify the duration in the seconds GET parameter. After you get the profile file, use the go tool pprof command to investigate the profile. CPU profile。可以在GET参数中指定以秒为单位的持续时间,默认是30s。在获得profile文件之后,使用go工具pprof命令来研究它。
- threadcreate: Stack traces that led to the creation of new OS threads. 导致创建新的操作系统线程的堆栈跟踪。
- trace: A trace of execution of the current program. You can specify the duration in the seconds GET parameter. After you get the trace file, use the go tool trace command to investigate the trace. 当前程序执行的痕迹。可以在GET参数中指定以秒为单位的持续时间。在获得trace文件之后,使用go工具 trace 命令来研究它。
pprof工具的交互式终端
使用方法
1 | # 方法一 |
source可以是通过”net/http/pprof” 包提供的http url ,也可以是本地 profile 文件。
cpu分析
1 | $ go tool pprof http://localhost:8090/debug/pprof/profile?seconds=15 |
执行该命令后,需等待seconds参数指定的时间(默认30s),采样完成后,即可用交互式命令进行分析,具体可以使用 help 指令查看说明,比如 top 可以查看占用 cpu 最多的 n 个记录。
1 | (pprof) top |
- flat:该位置的运行耗时
- flat%:该位置的 CPU 运行耗时总比例
- sum%:该位置累积使用 CPU 总比例
- cum:该位置加上它的子调用运行总耗时
- cum%:该位置加上它的的子调用的 CPU 运行耗时总比例
最后一列为函数调用的位置。
1 | (pprof) help list |
通过list命令可以查看关联的代码,比如这里可以看出XXCPU的Run方法里面,有个循环的代码会消耗较多的 cpu 。
内存分析
1 | $ go tool pprof http://localhost:8090/debug/pprof/heap |
同样通过top和list大法,找出内存分配较多的地方。
协程分析
1 | $ go tool pprof http://localhost:8090/debug/pprof/goroutine |
同样通过top和list大法,找出协程分配较多的地方。
pprof工具的可视化界面
使用方法
1 | # 方法一 |
cpu分析
执行命令
1 | go tool pprof -http=:8091 http://localhost:8090/debug/pprof/profile?seconds=15 |
可视化Graph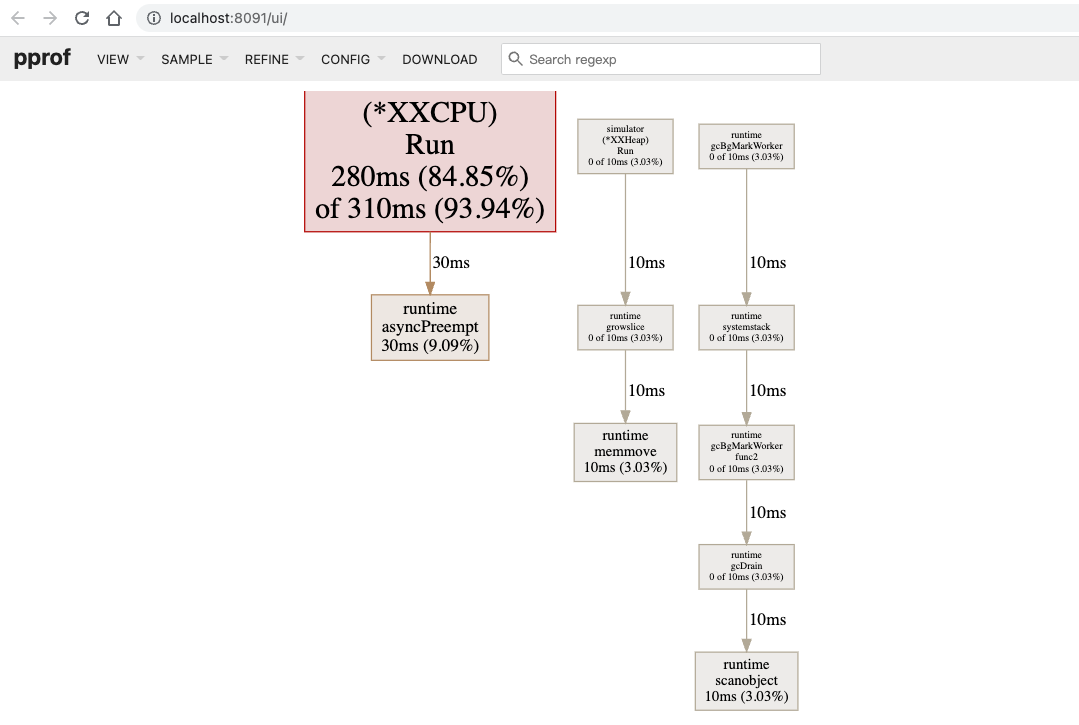
框越大线越粗,代表该代码处占用的时间越长。
可视化Top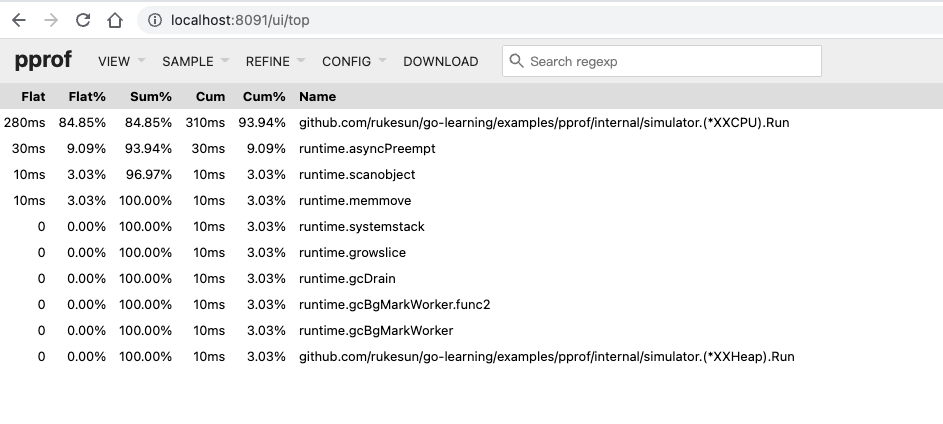
可视化火焰图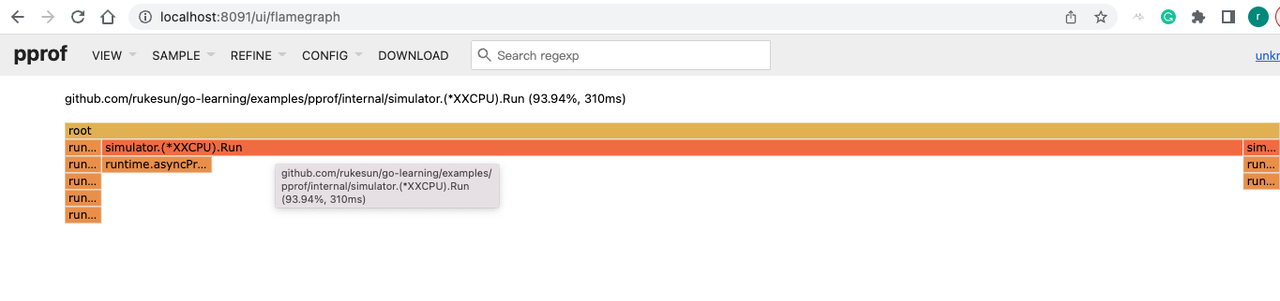
火焰图(Flame Graph)是由 Linux 性能优化大师 Brendan Gregg 发明的,它以一个全局的视野来看待时间分布,并且列出所有可能导致性能瓶颈的调用栈。
火焰图有以下特征:
- 每一列代表一个调用栈,每一个格子代表一个函数。
- 纵轴展示了栈的深度,正立火焰图按照调用关系从下到上排列(倒立火焰图方向刚好相反)。
- 横轴部分,火焰图将采集的多个调用栈信息,通过按字母横向排序的方式将众多信息聚合在一起。需要注意的是它并不代表时间的先后。横轴格子的宽度代表其在采样中出现频率,所以一个格子的宽度越大,说明它是瓶颈原因的可能性就越大。
- 火焰图格子的颜色是随机的暖色调,方便区分各个调用信息。
可视化Peek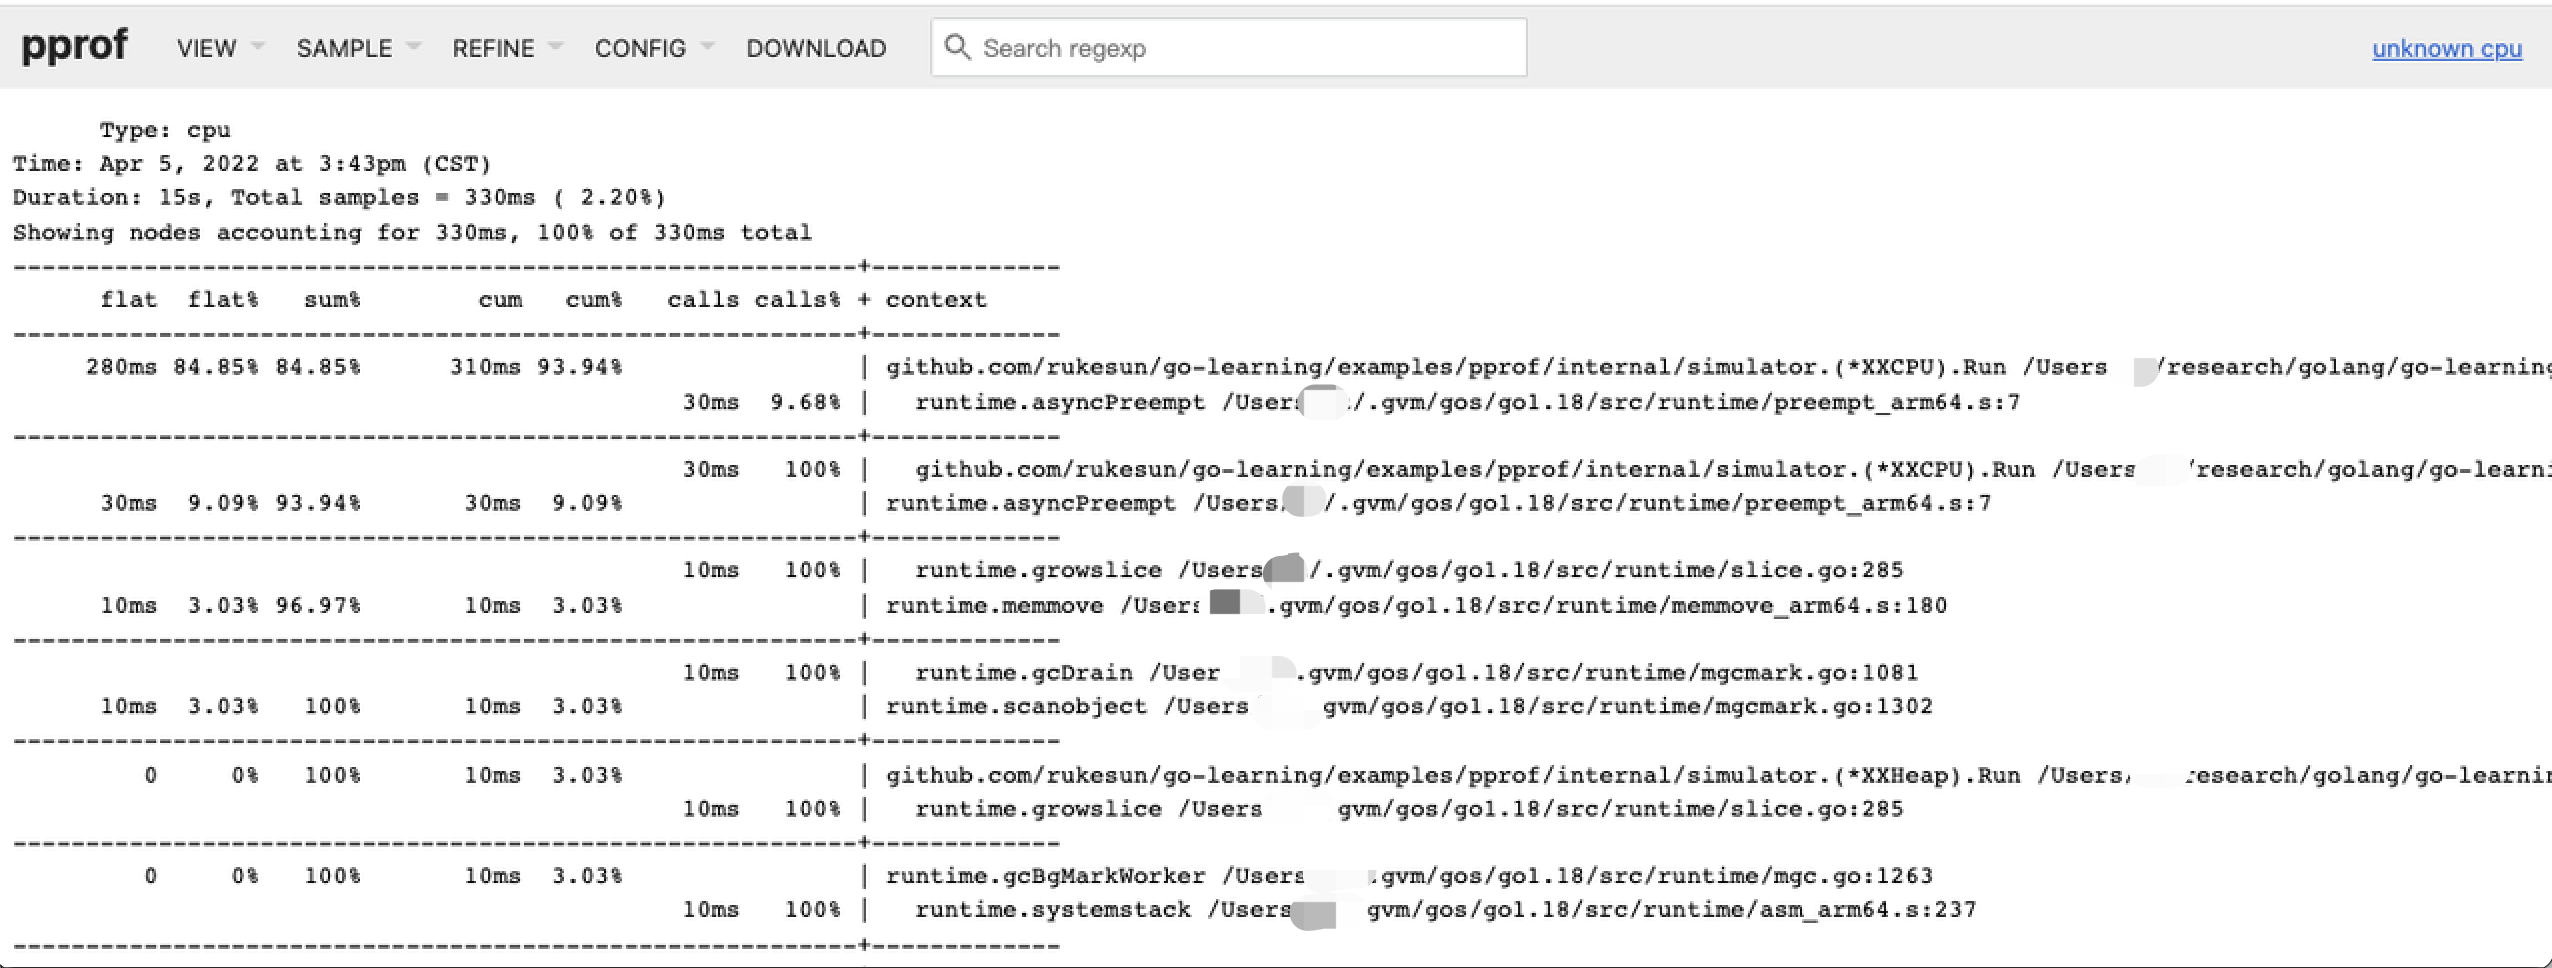
可视化Source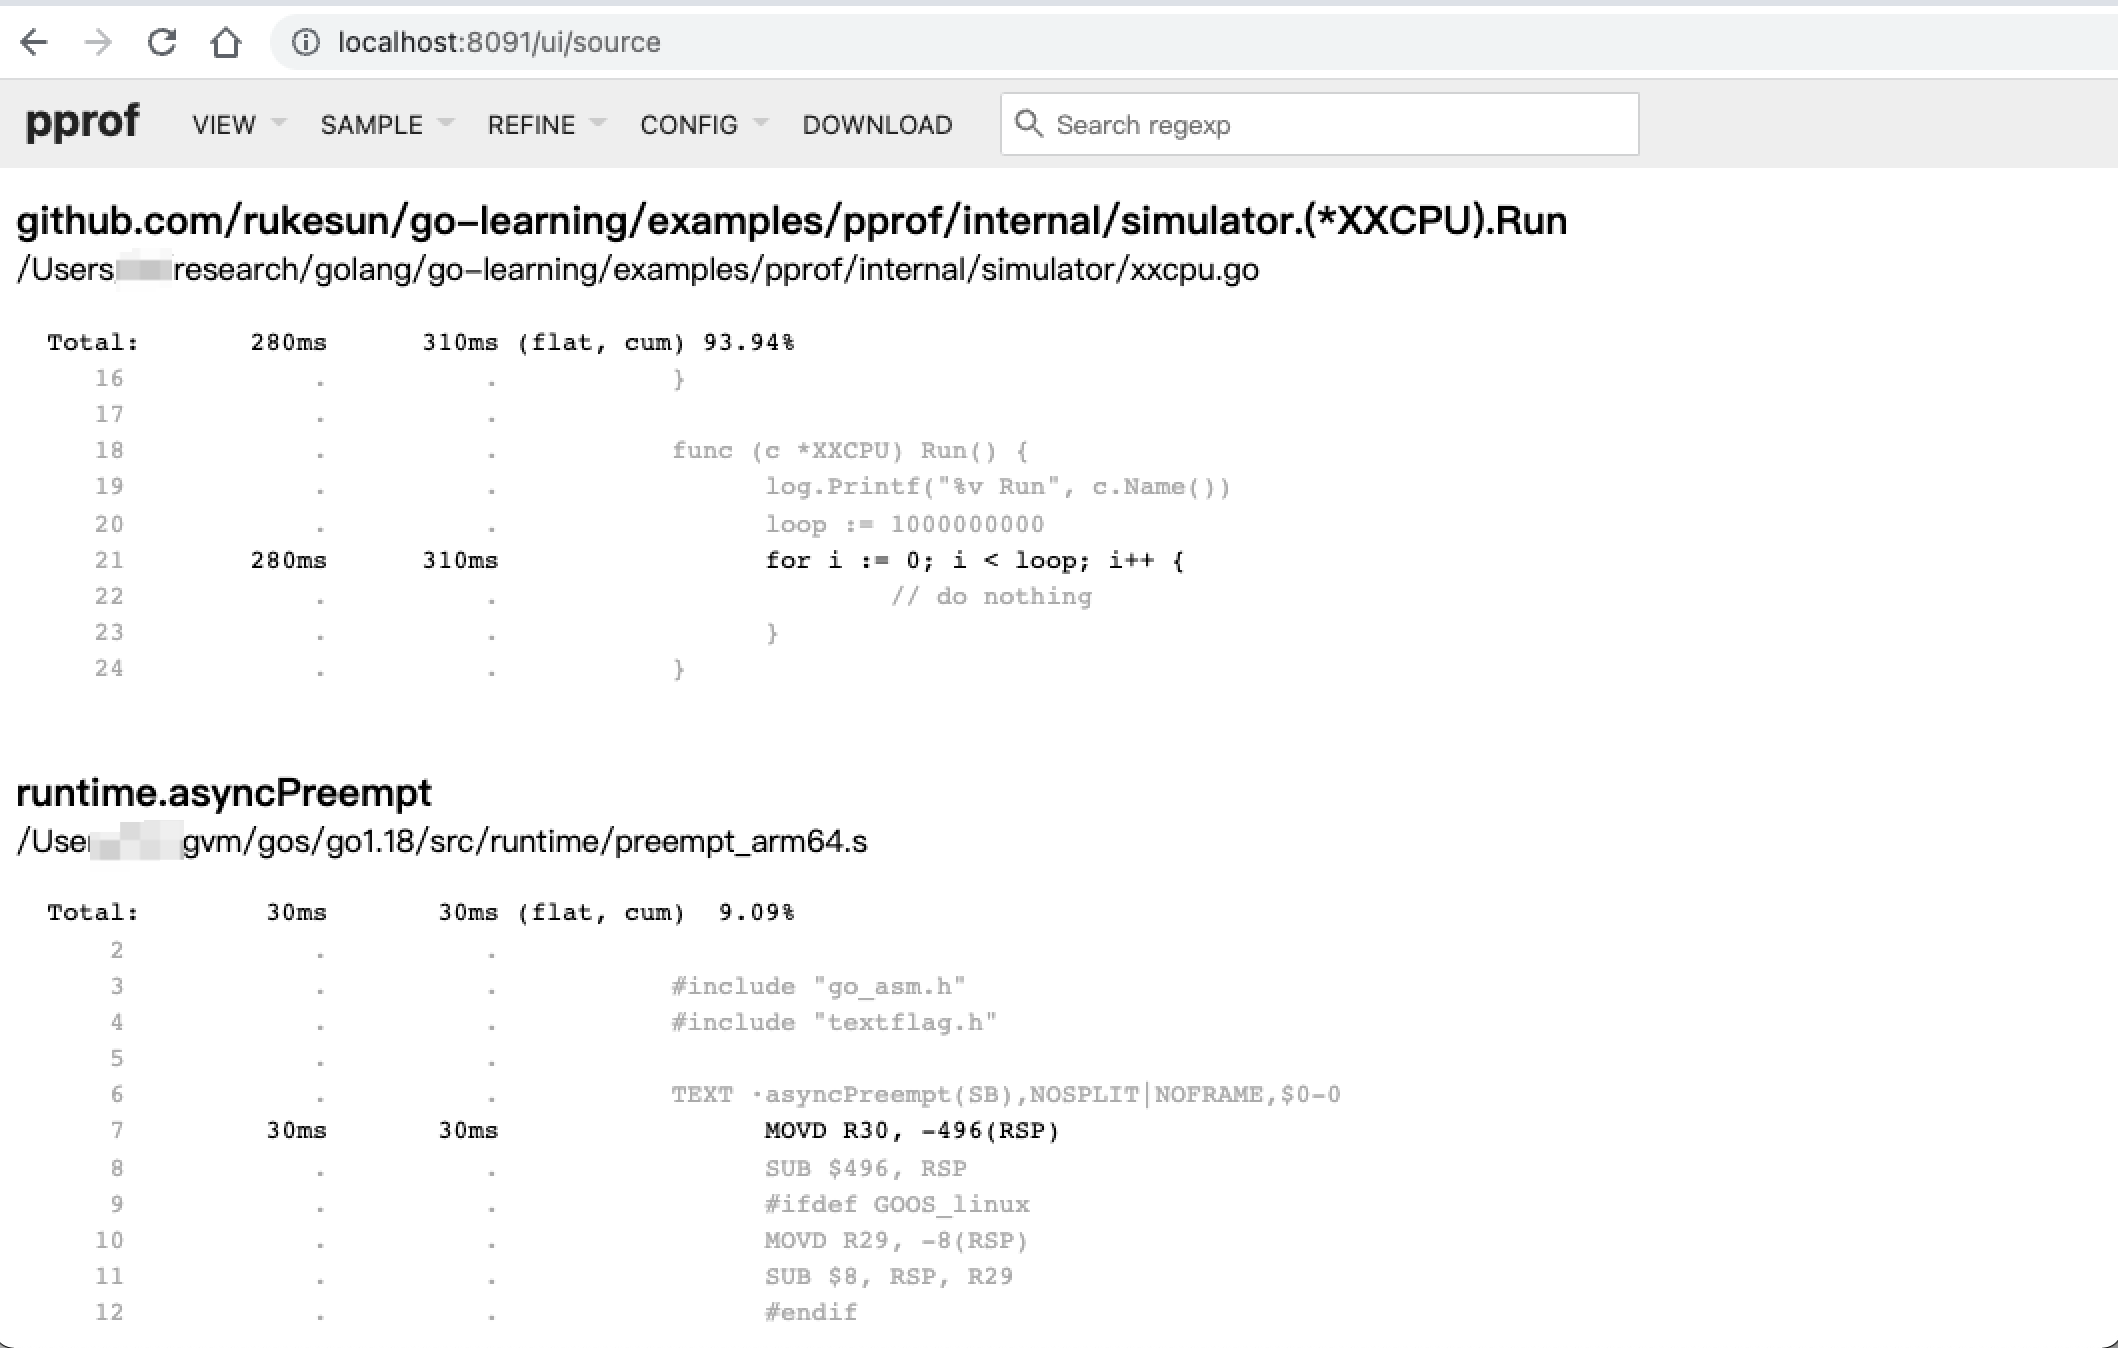
内存分析
1 | go tool pprof -http=:8091 http://localhost:8090/debug/pprof/heap |
可视化Graph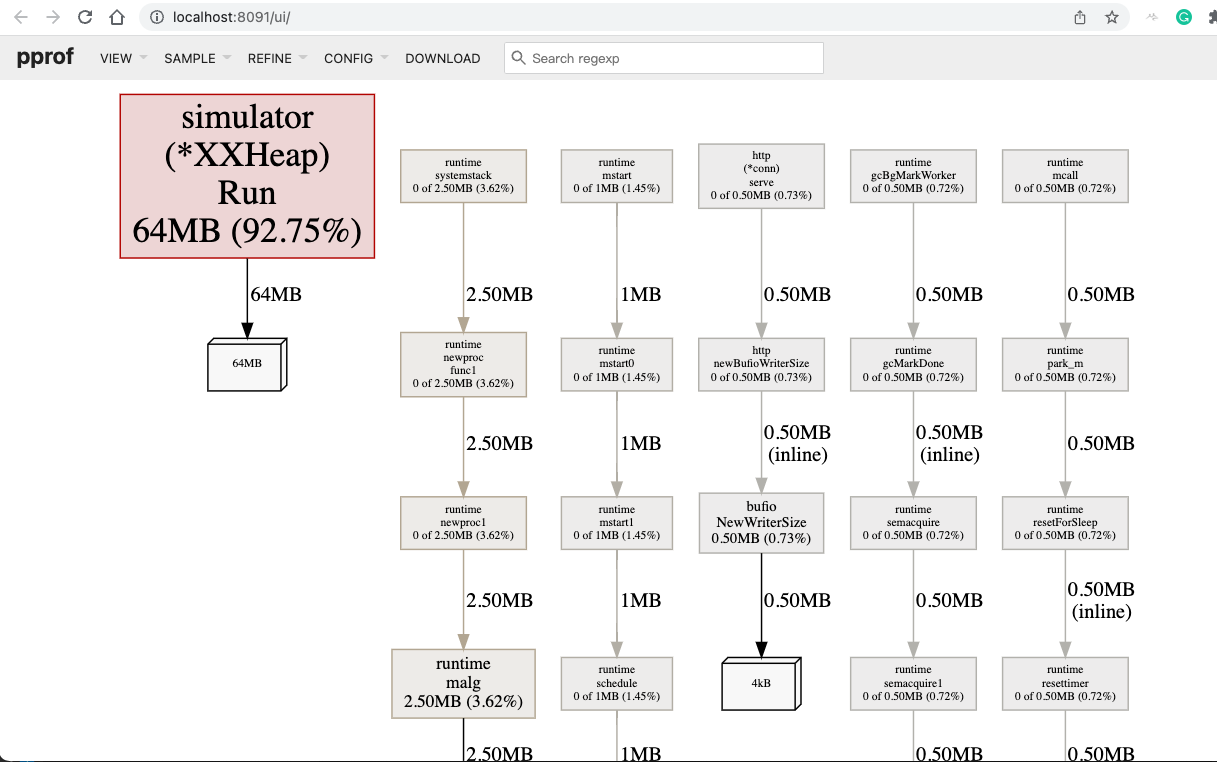
其他图表请参考 cpu 分析部分,这里不再一一列举。
协程分析
执行命令
1 | go tool pprof -http=:8091 http://localhost:8090/debug/pprof/goroutine |
可视化Graph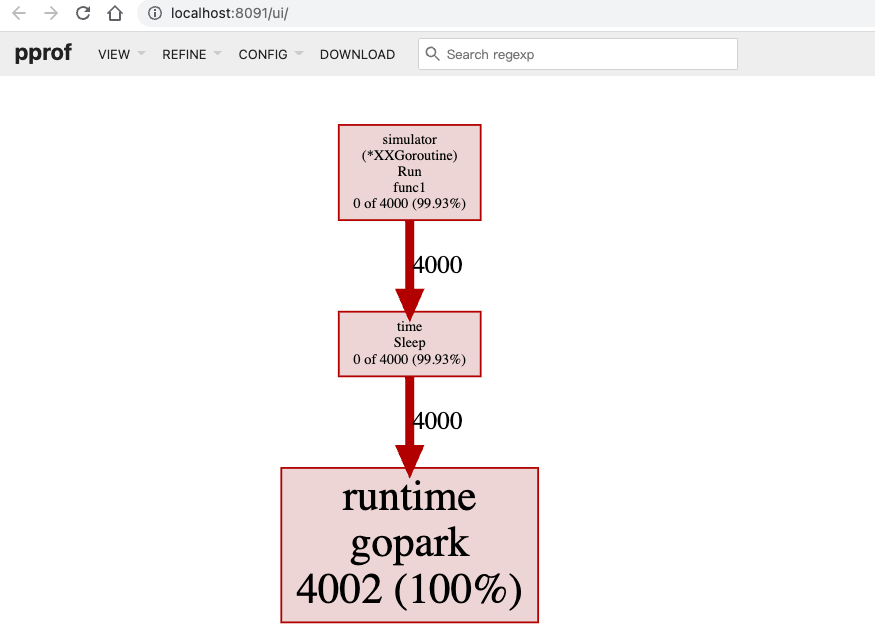
其他图表请参考 cpu 分析部分,这里不再一一列举。
使用runtime/pprof生成profile文件调试
之前的章节使用 net/http/pprof 提供的 HTTP 接口进行调试分析,如果是非 HTTP 的程序或者因为数据安全问题,我们不想暴露 HTTP 接口,那么我们该如何分析调试?答案是在代码中引入 runtime/pprof 包,示例代码如下:
1 | var cpuprofile = flag.String("cpuprofile", "", "write cpu profile to `file`") |
完整代码请参考 demo 工程的 pprof/internal/xxprof/xxprof.go ,通过上面的代码生成相关的 profile 文件之后,使用 pprof 工具即可分析调试。
另外,为了便于使用,我们可以结合 signal 来使用,示例代码
1 | package xxsignal |
在需要使用的程序 import xxsignal ,然后通过kill发送相关的信号即可。注意,使用 signal 时,需要使用 go build 编译成二进制可执行文件,通过 go run 的方式则不能捕获相关的信号。
1 | kill -SIGUSR2 ${pid} |
参考资料
- Debugging in Visual Studio Code, https://code.visualstudio.com/docs/editor/debugging
- Running | Goland, https://www.jetbrains.com/help/go/running-applications.html
- Debugging | Goland, https://www.jetbrains.com/help/go/debugging-code.html
- PProf README, https://github.com/google/pprof/blob/master/doc/README.md
- Profiling a Go program, https://pkg.go.dev/runtime/pprof@go1.18#hdr-Profiling_a_Go_program
- Go tool pprof, https://github.com/eddycjy/blog/blob/master/content/posts/go/tools/2018-09-15-go-tool-pprof.md
- Go pprof practice, https://blog.wolfogre.com/posts/go-ppof-practice/
- Go Zero profile, https://github.com/zeromicro/go-zero/blob/master/core/proc/profile.go